Web Dashboard
Ferrous DNS includes a built-in web dashboard for monitoring and managing your DNS server. It runs on the same port as the REST API (web_port, default 8080) with no additional setup required.
Accessing the Dashboard
Open your browser and navigate to:
The dashboard is a single-page application built with HTMX + Alpine.js + TailwindCSS and compiled into the server binary — no external dependencies, no Node.js, no build step.
Dashboard Pages
Main Dashboard
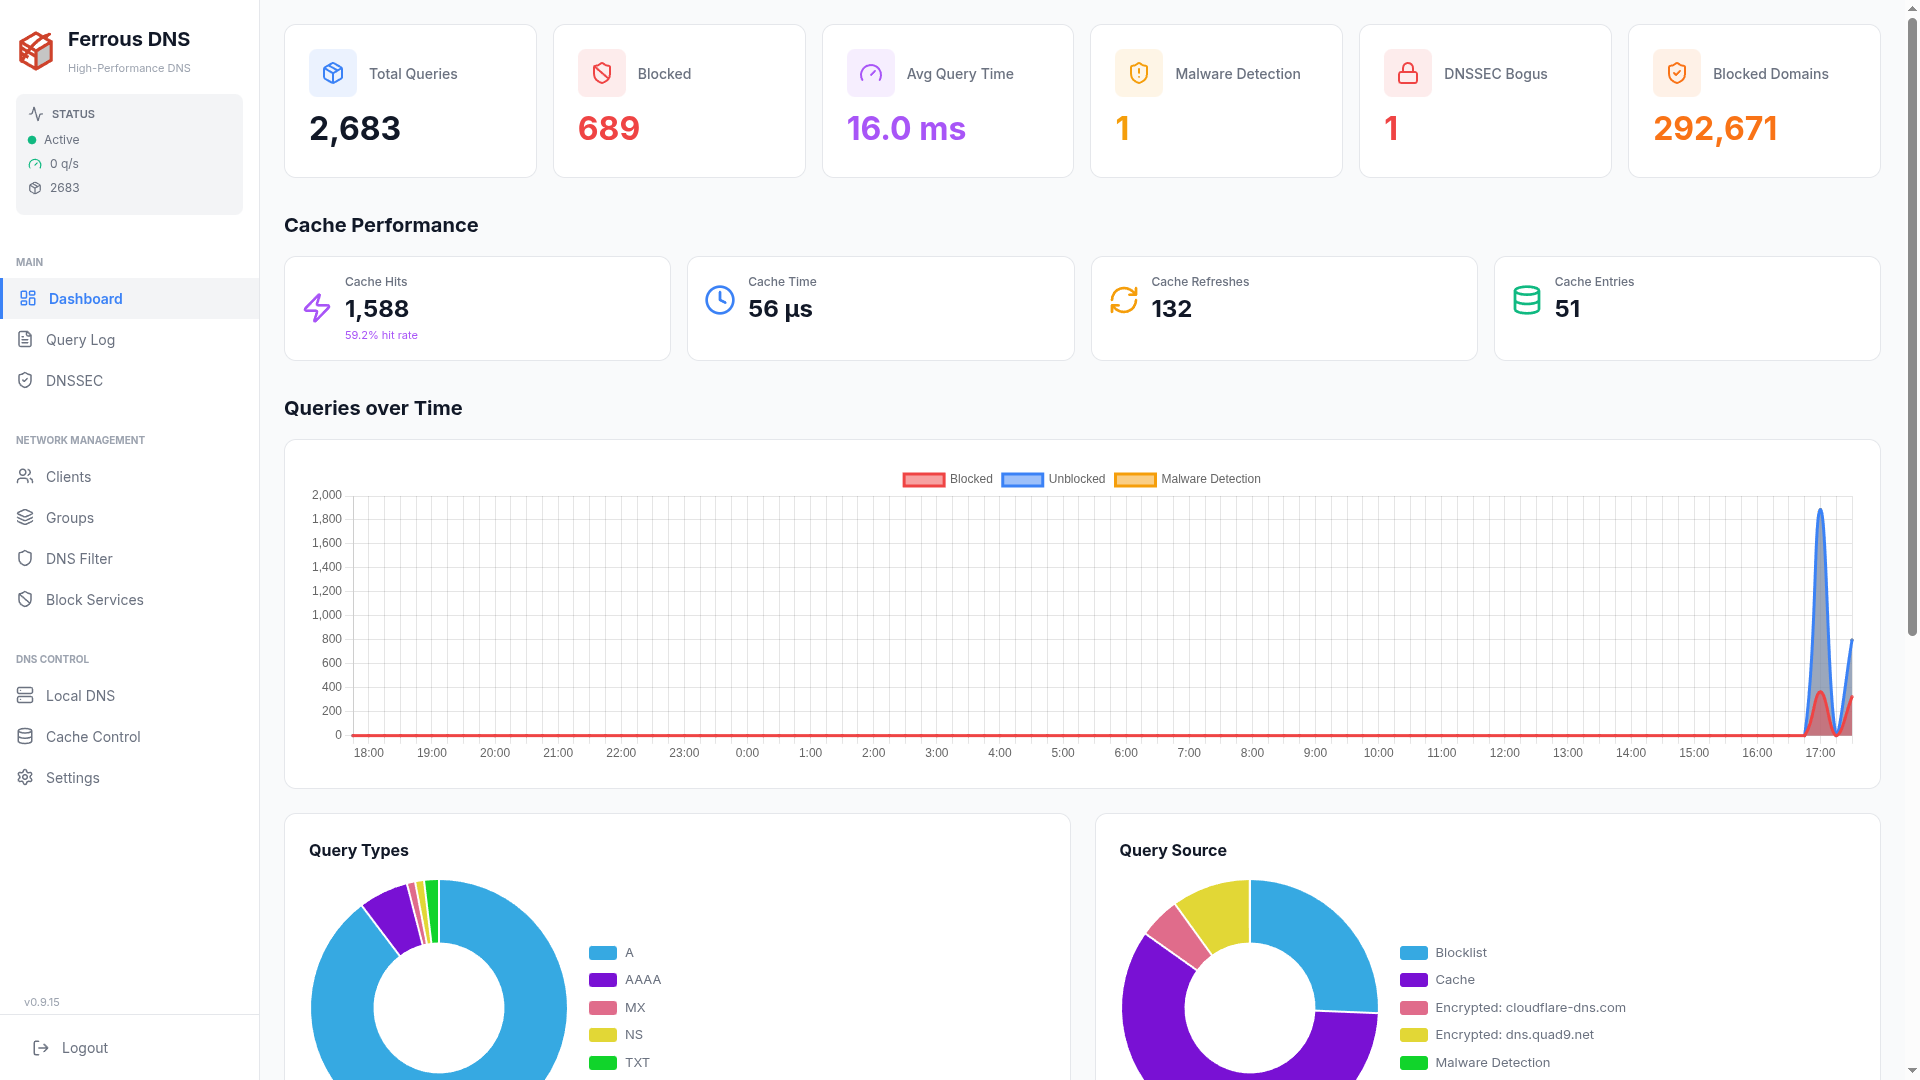
The landing page shows a real-time overview of your DNS server:
- Query rate — live queries per second with color-coded indicator
- Total queries — cumulative count since last restart
- Blocked queries — total blocked with percentage
- Rate limited queries — count of queries throttled by the rate limiter
- Block rate — ratio of blocked to total queries
- Query timeline — visual graph of query volume over time (allowed, blocked, and rate-limited)
- Top queried domains — most popular DNS lookups
- Top blocked domains — most frequently blocked domains
- Top clients — most active clients by query count
- Block filter stats — blocklist size, total entries
Queries
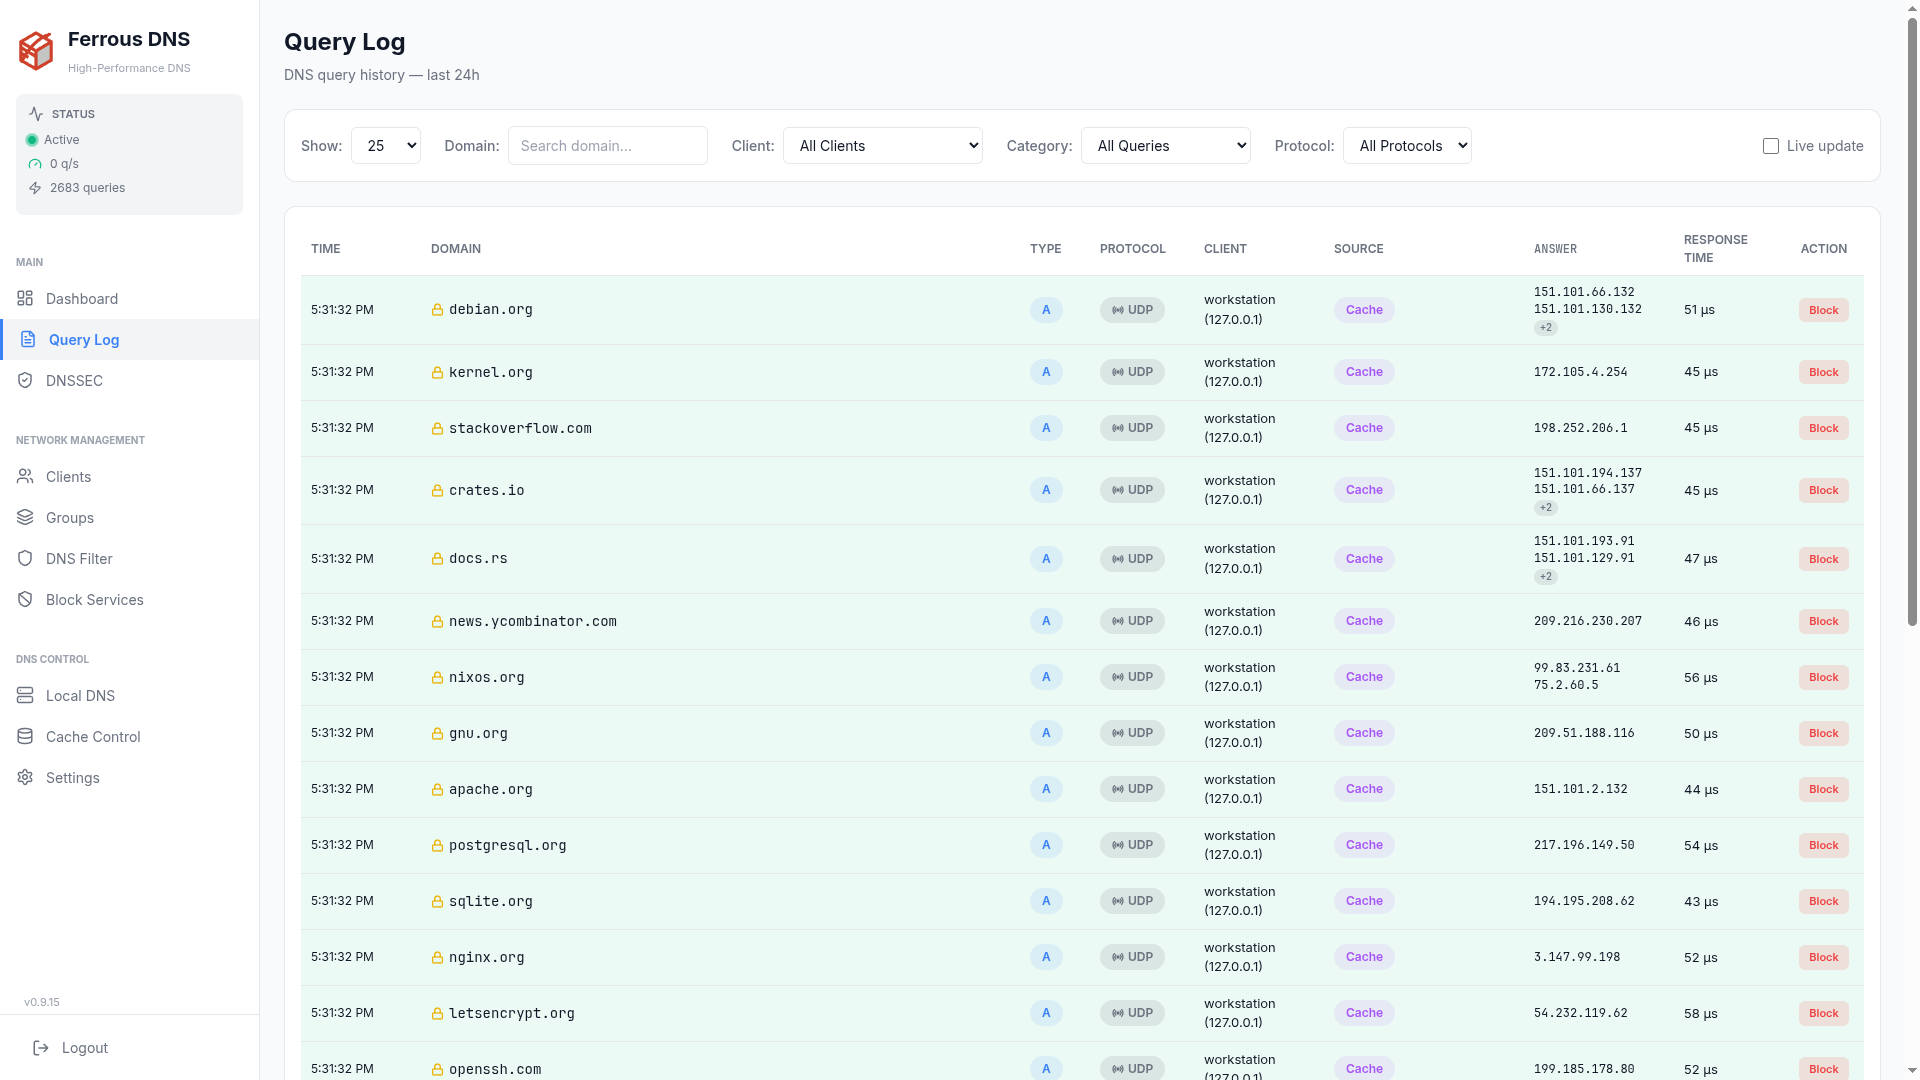
Live query log with:
- Domain name, query type (A, AAAA, CNAME, MX, etc.)
- Client IP and hostname
- Transport the client used to reach the resolver (UDP, TCP, DoT, DoH, DoQ)
- Response status (allowed, blocked, cached, rate-limited)
- Response time
- Filter by category: allowed, blocked, rate-limited
- Filter by protocol: UDP, TCP, DoT, DoH, DoQ
- Quick actions: Block or Allow a domain with one click
DNSSEC
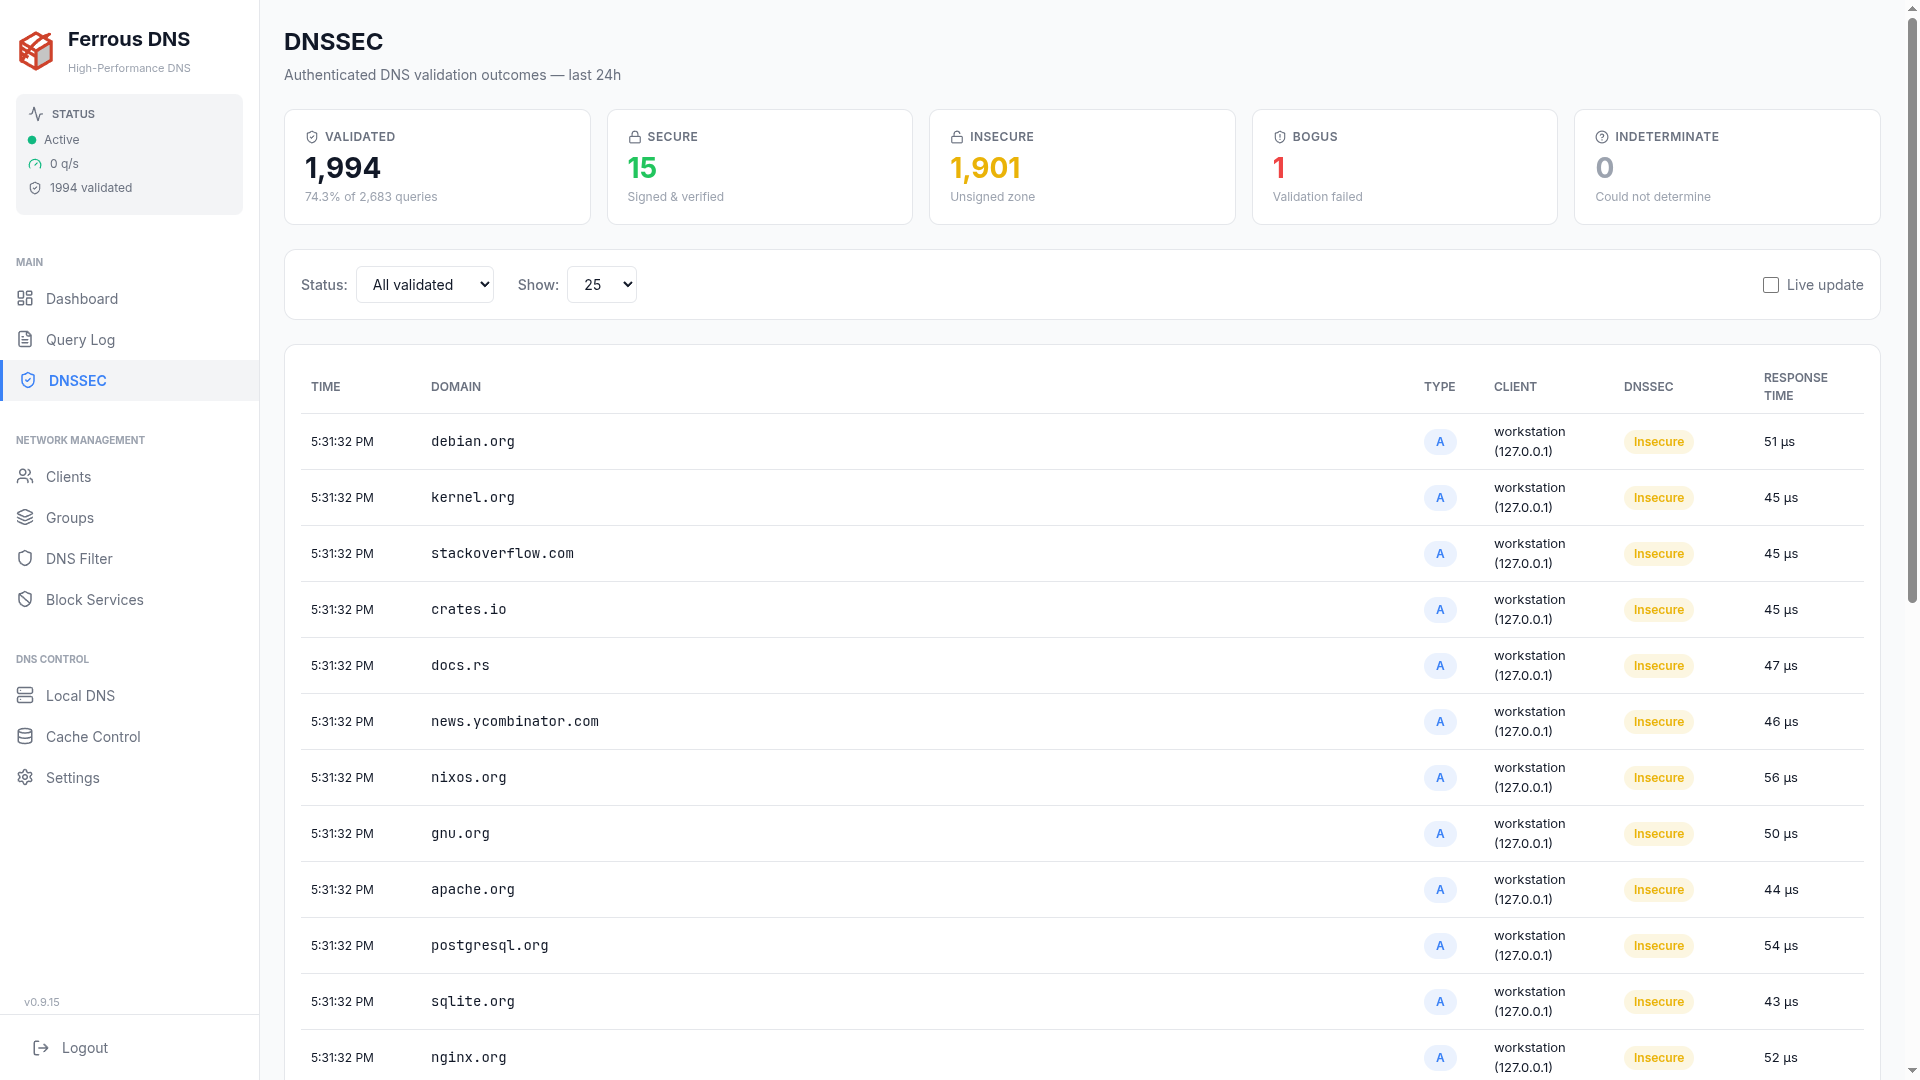
Validation outcomes for the last 24 hours, summarised and then listed per query:
- Validated — how many answers went through validation, and what share of all queries that is
- Secure — signed and cryptographically verified
- Insecure — the zone is unsigned, so there was nothing to verify
- Bogus — validation failed; under
dnssec_mode = "Strict"these answers become SERVFAIL - Indeterminate — the chain of trust could not be resolved either way
- Filter the listing by status, and follow it live with Live update
Clients
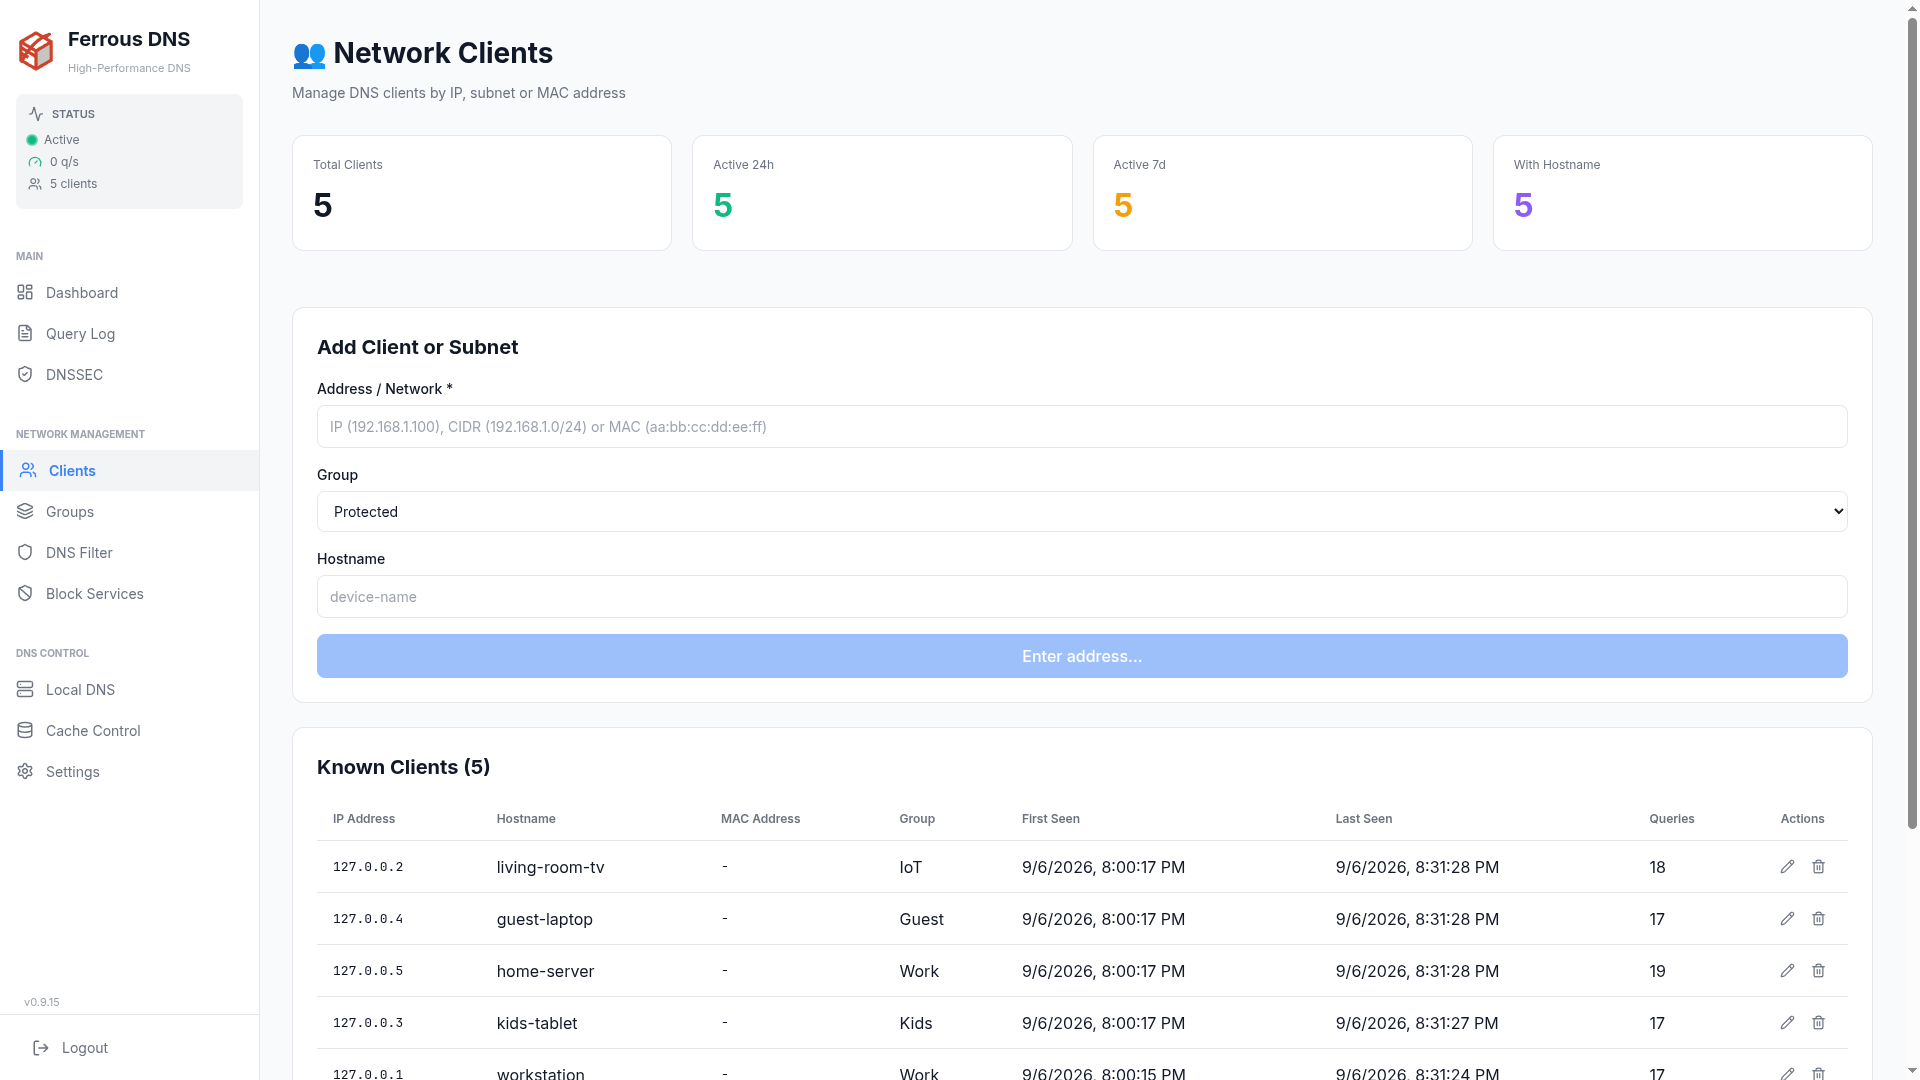
- Auto-detected clients with IP, MAC address, and hostname
- Query count and block rate per client
- Group assignment
- Manual client creation
- Client subnet rules (auto-assign by CIDR range)
Groups
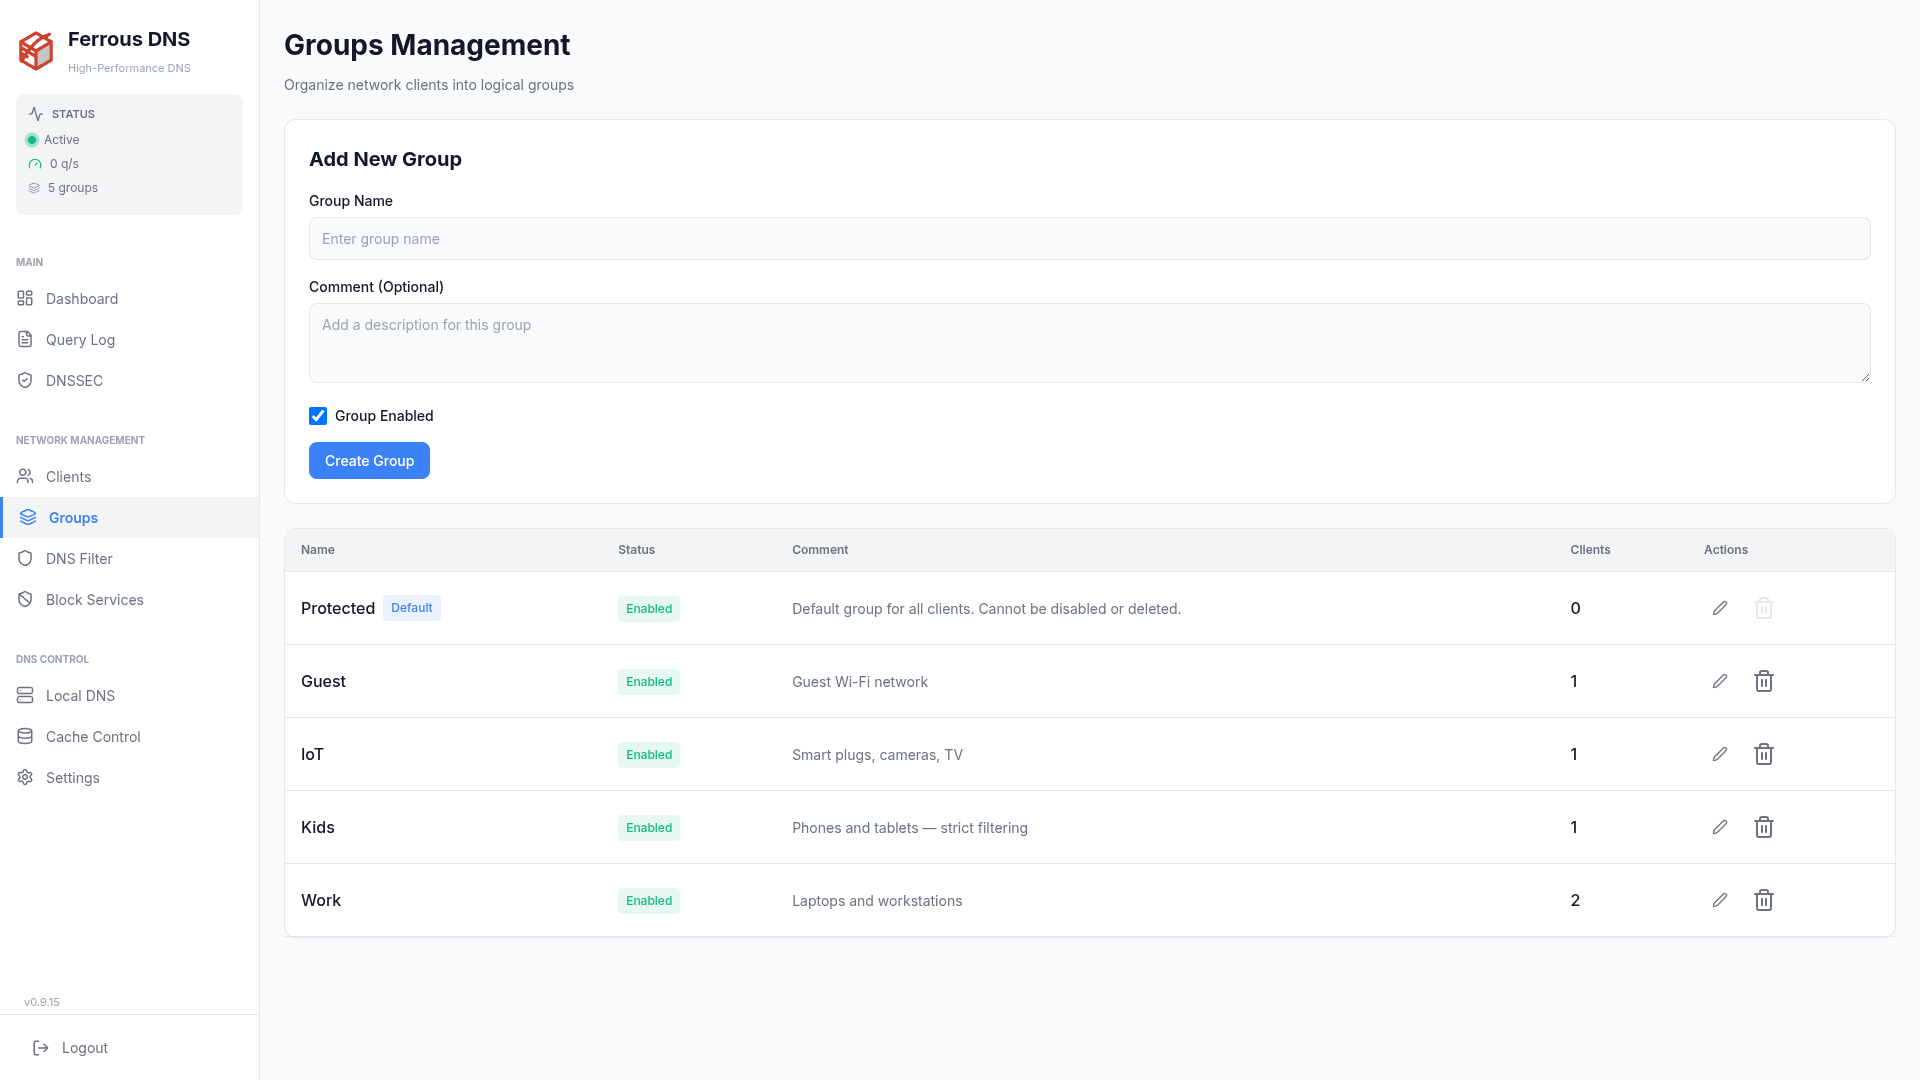
- Create and manage client groups (Kids, Work, IoT, Guest)
- Assign clients to groups
- Each group can have independent blocking policies
DNS Filter
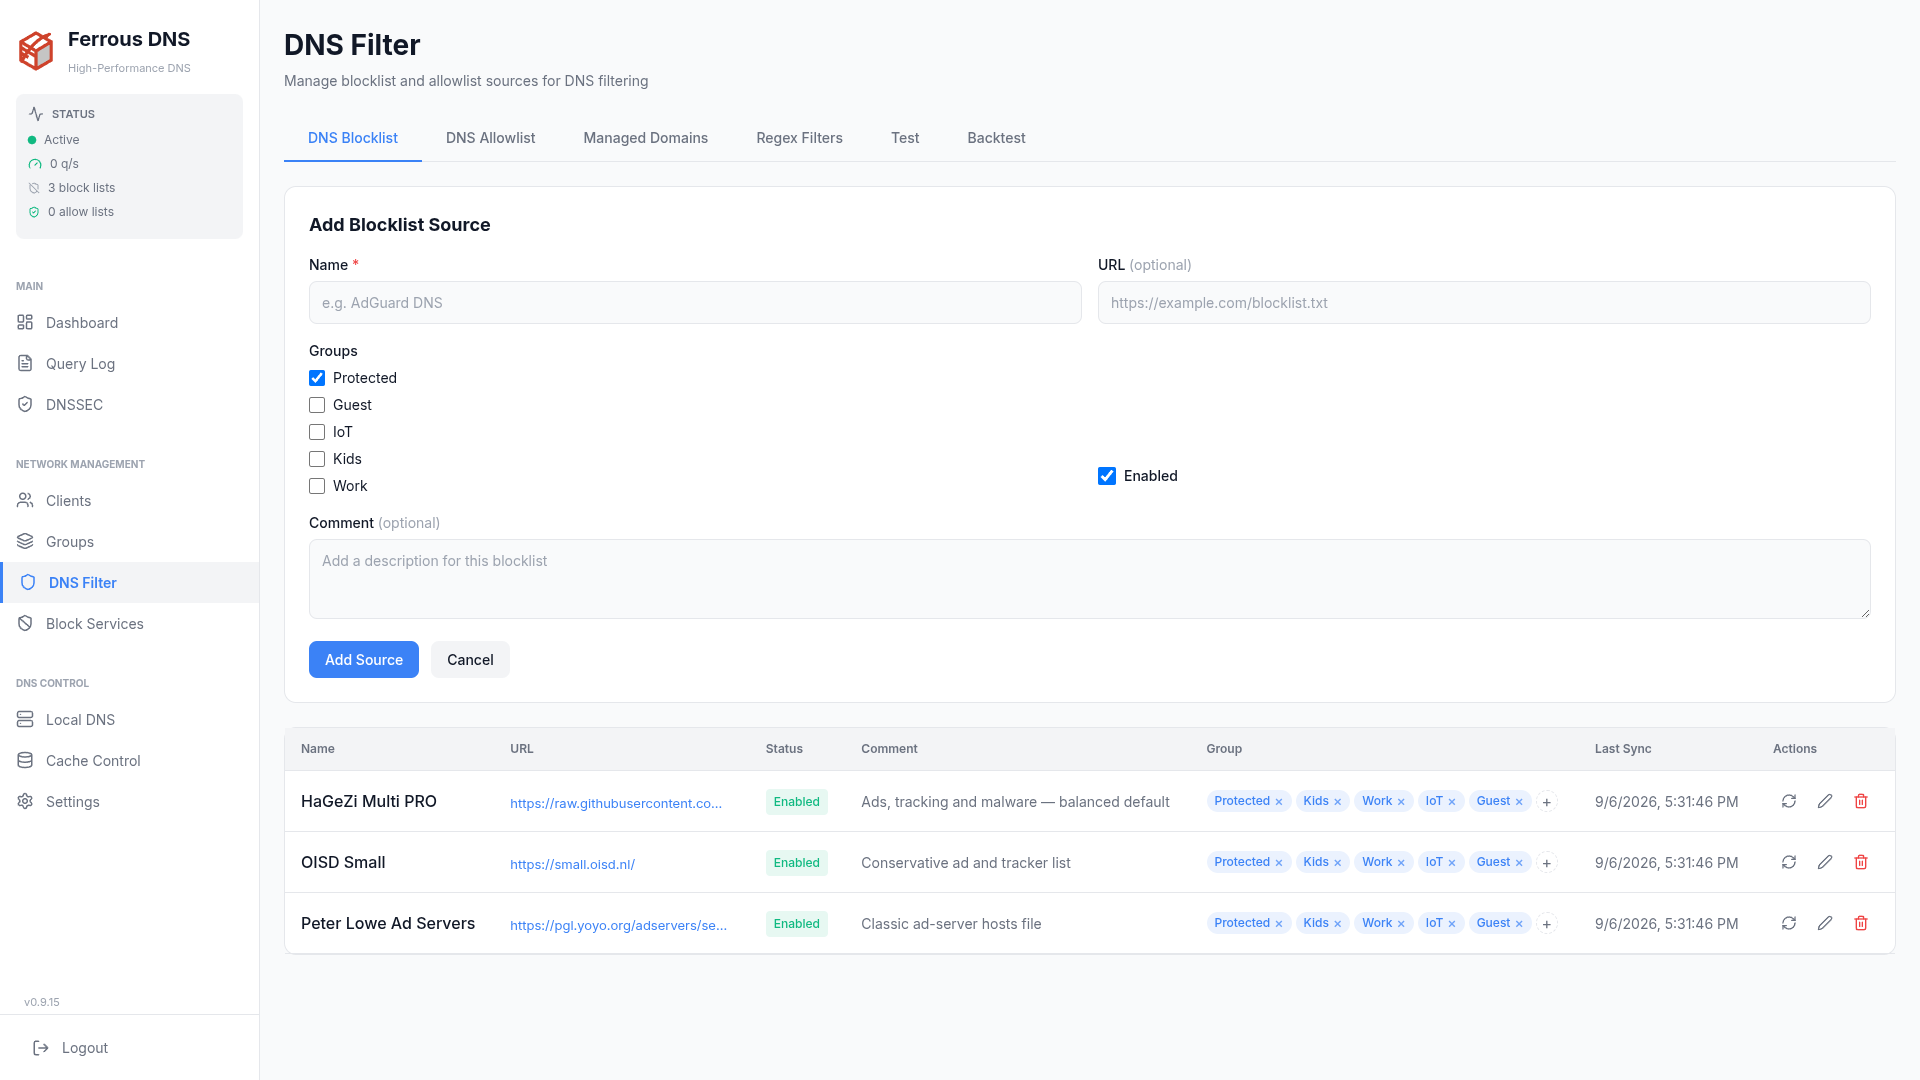
Multi-tab filtering management:
- Blocklist Sources — add, enable/disable and remove external blocklist URLs; each row carries a refresh action that re-downloads it on demand
- Whitelist Sources — add external allowlist URLs
- Managed Domains — individual block/allow domains
- Regex Filters — pattern-based blocking rules
Both source tabs carry a Last Sync column recording when each URL was last downloaded successfully. An empty value means the source has never been fetched without error — which is how a dead URL becomes visible, since a failed download is otherwise only written to the log.
Block Services
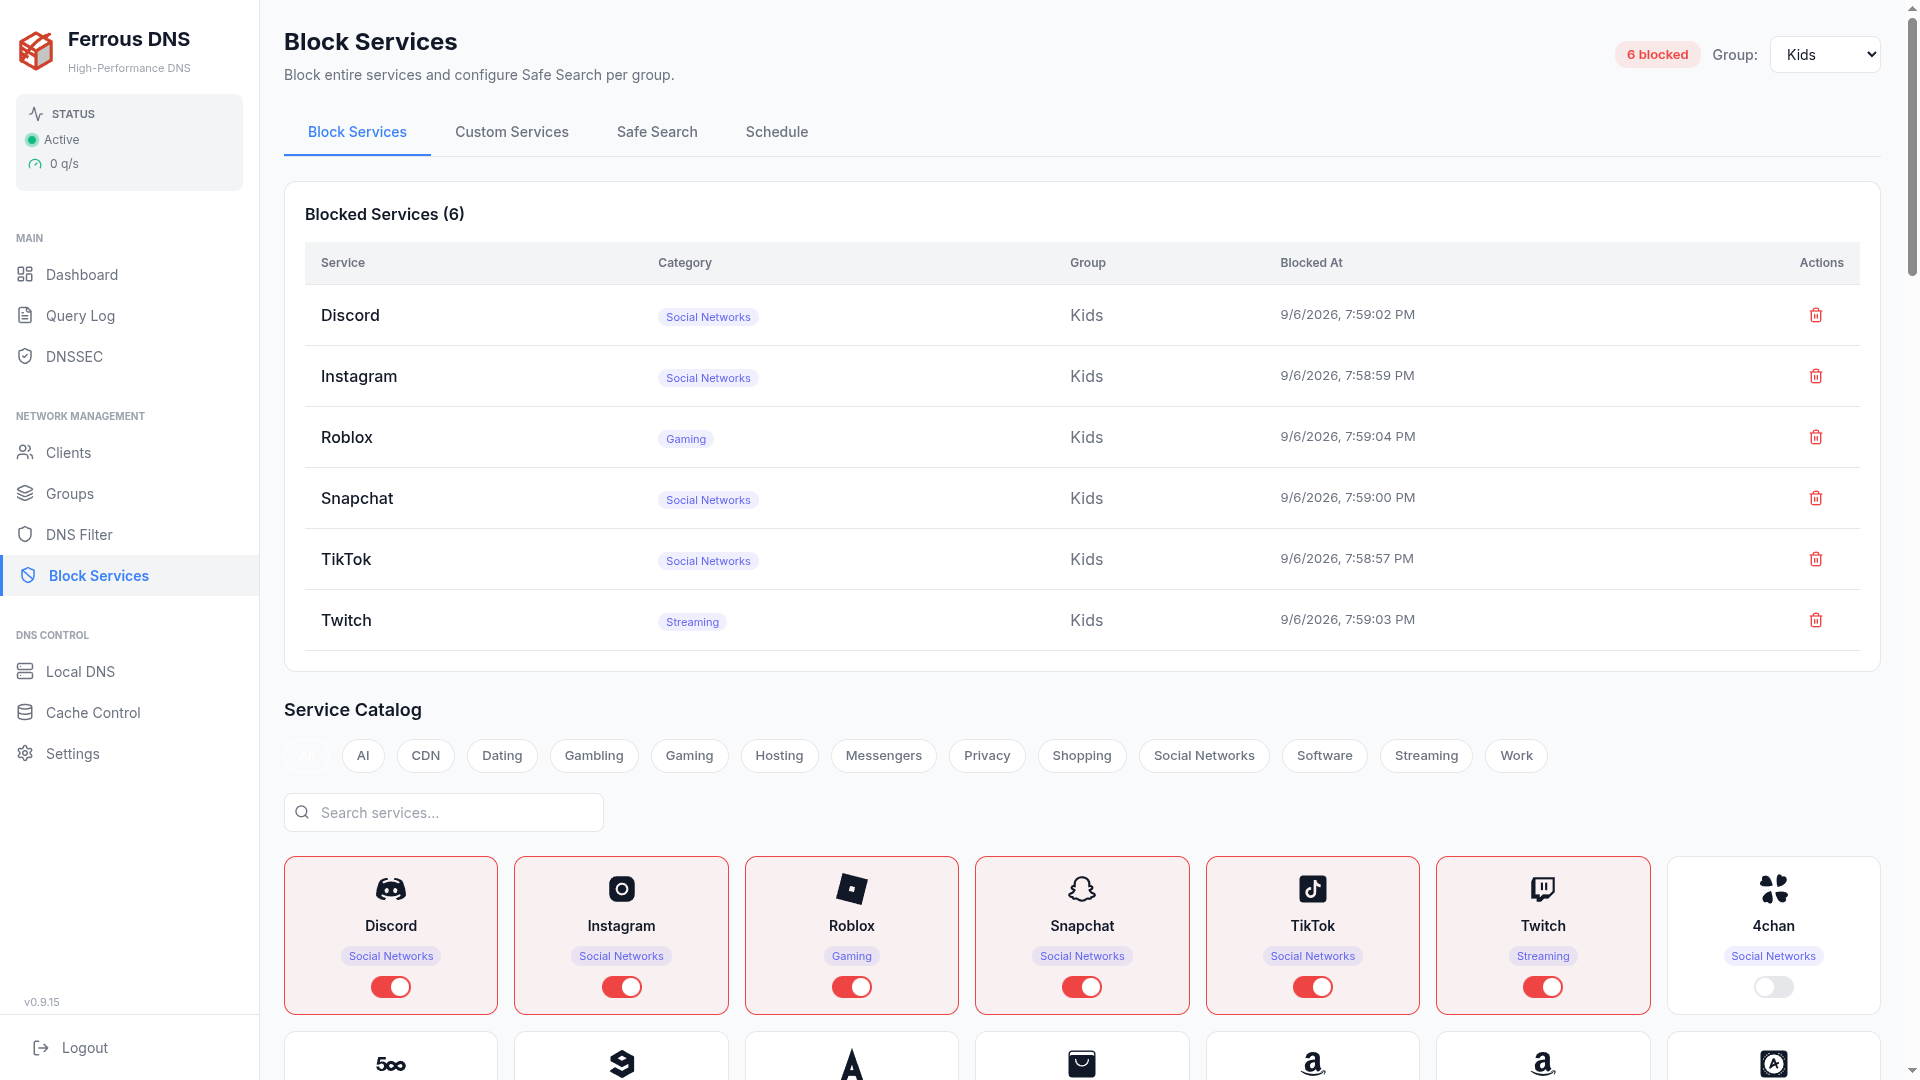
- Service Catalog — 1-click block/unblock of pre-defined service categories (Social Media, Ads, Tracking, Gambling, Adult Content)
- Custom Services — define your own service categories with domain lists
- Safe Search — enforce safe search per group (Google, Bing, YouTube, DuckDuckGo, Yandex, Brave, Ecosia)
- Schedule Profiles — time-based blocking with day/time slot management
Local DNS
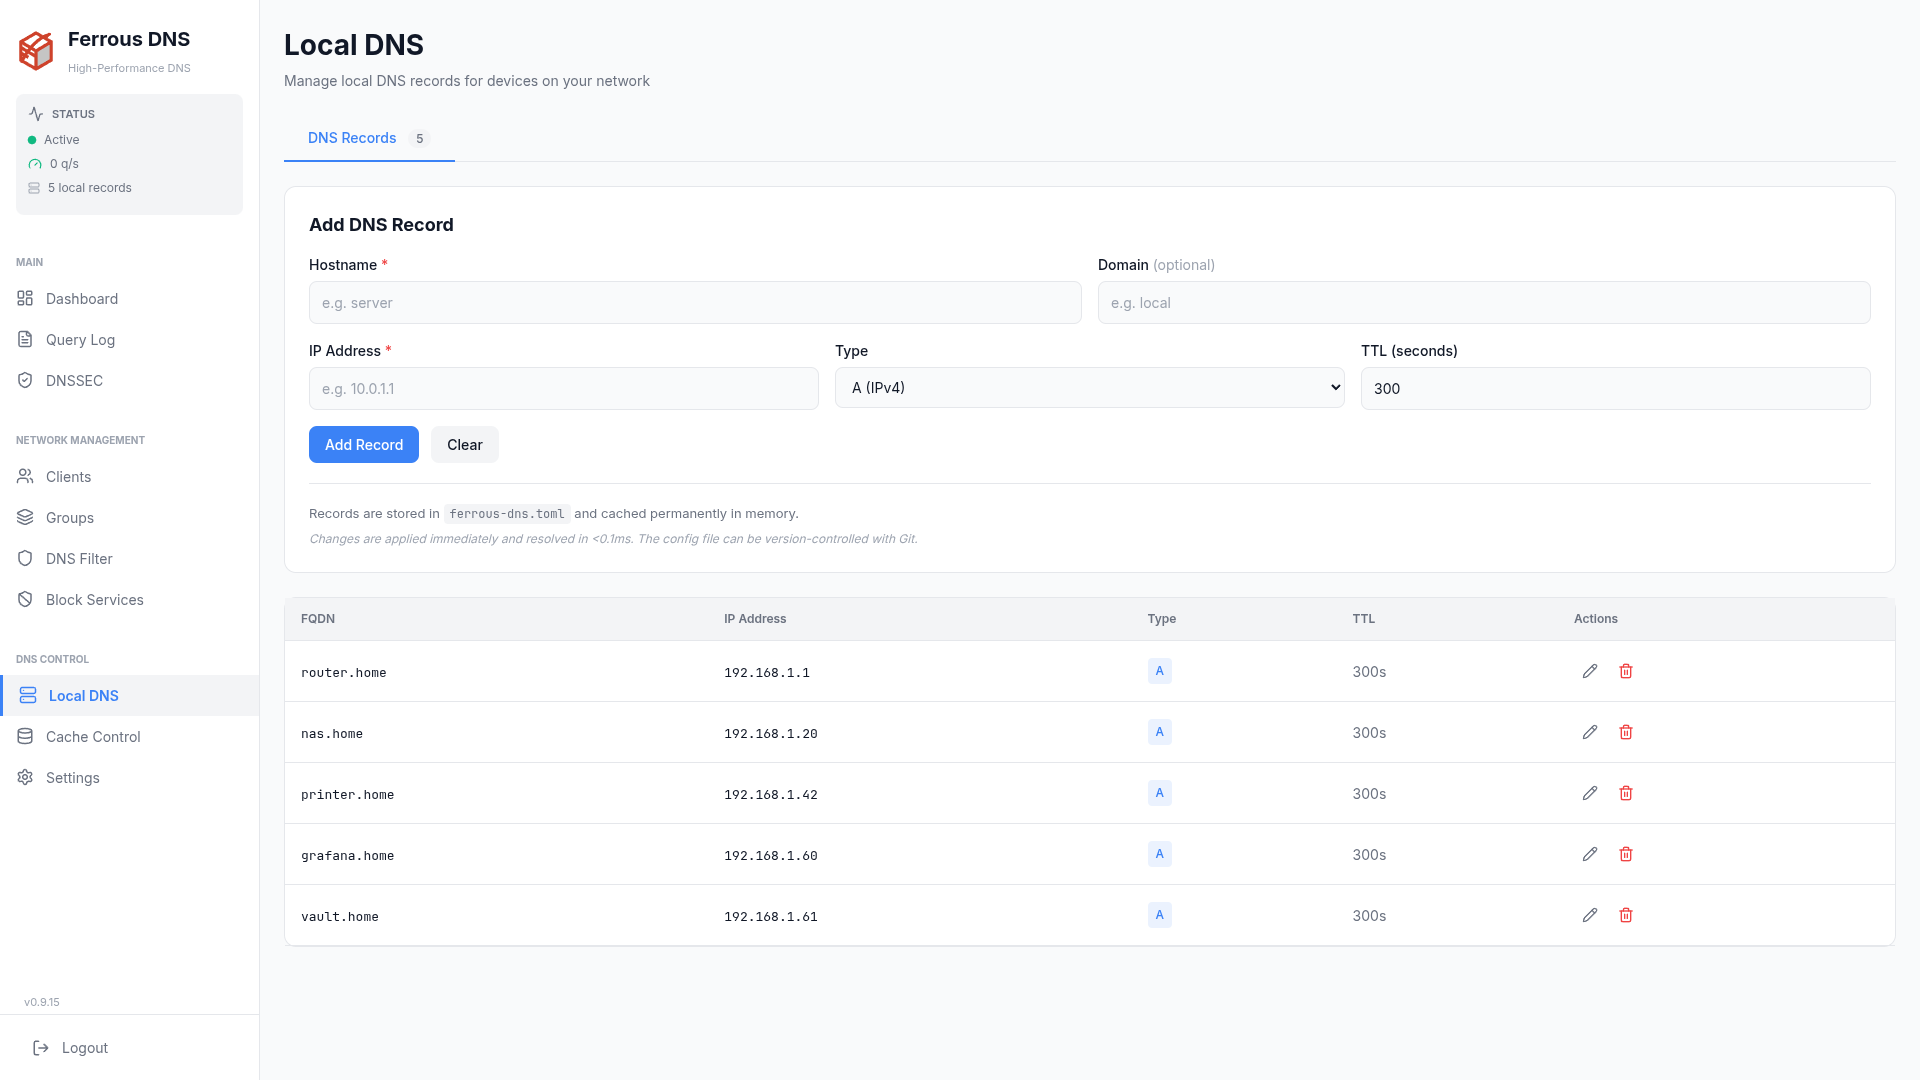
- Manage static A/AAAA records
- Automatic PTR generation from A records
- Conditional forwarding configuration
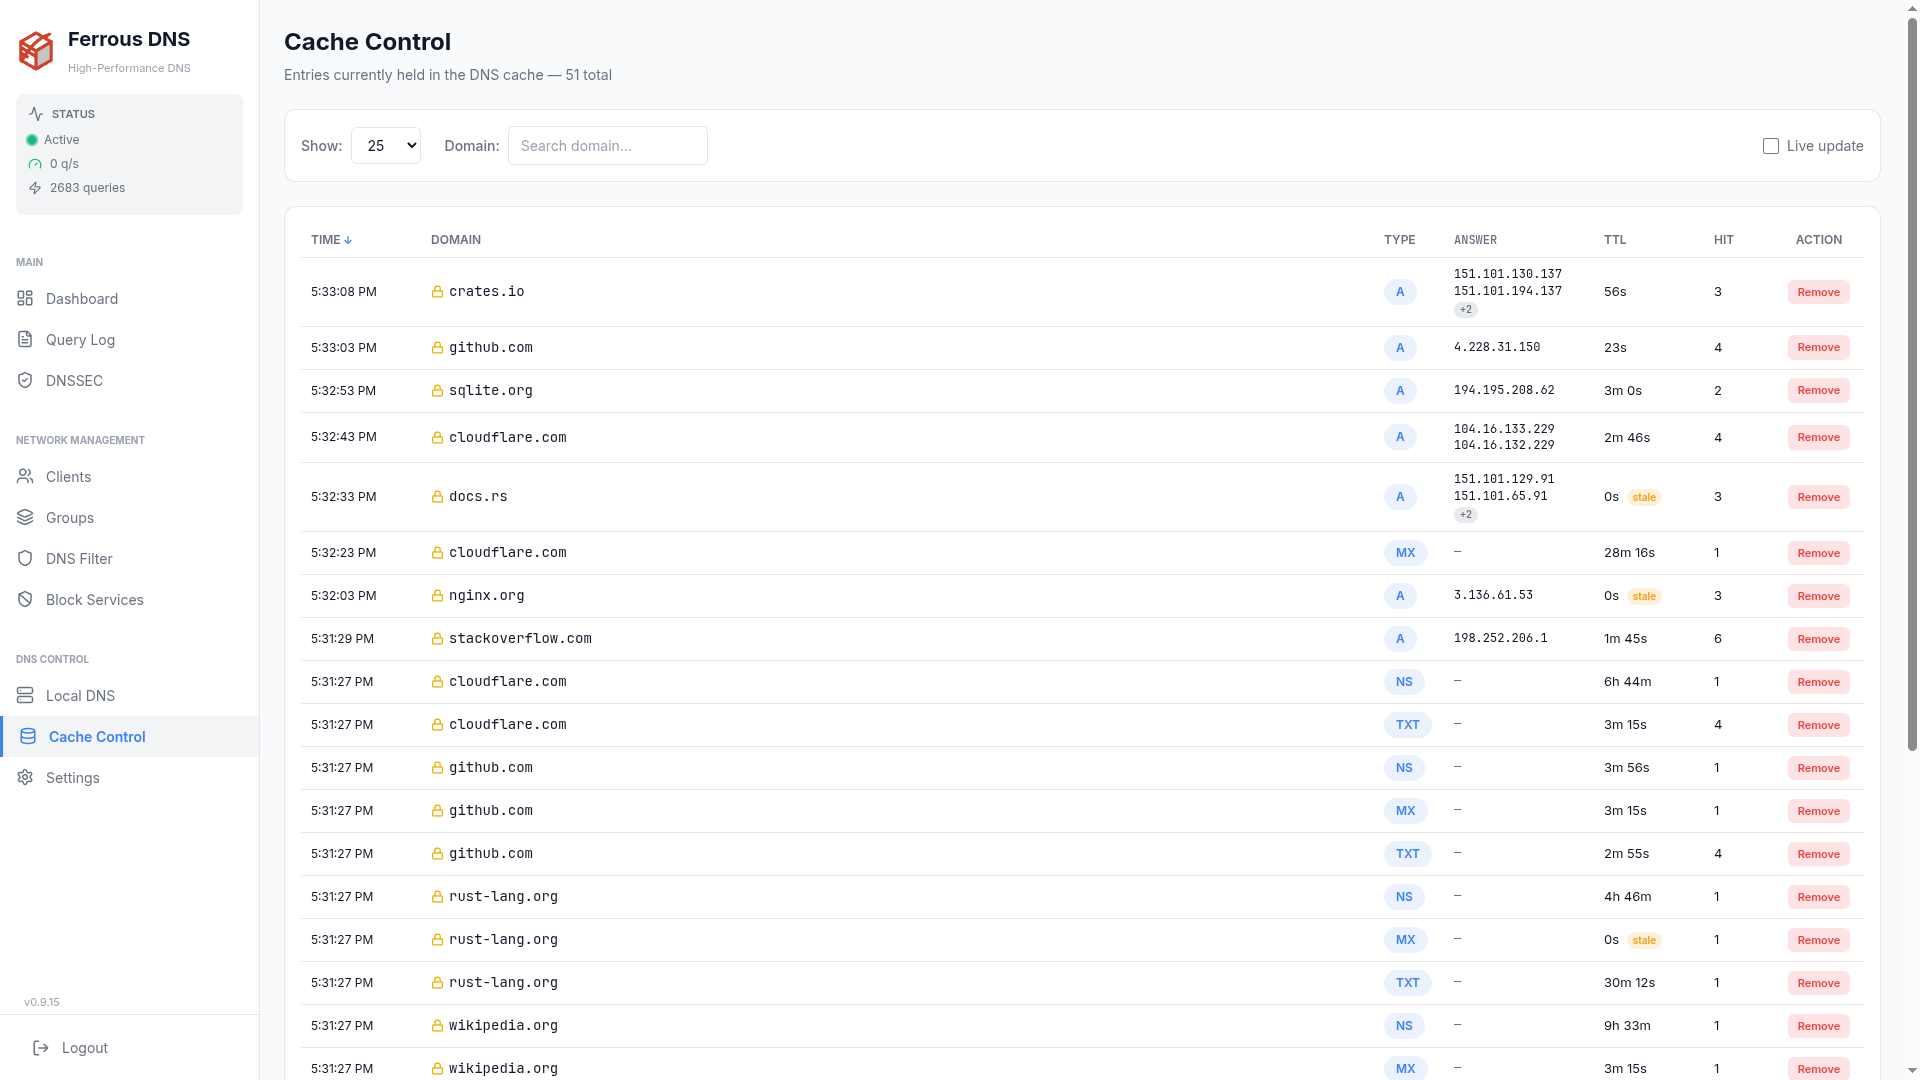
Cache Control
- Lists the entries currently held in the DNS cache: insertion time, remaining TTL, domain (with DNSSEC validation status), record type, answer, and hit count
- Search by domain substring
- Sort by clicking any column header (repeat click reverses the direction)
- Paginated listing with a configurable page size
- Remove — drop an individual entry from the cache
Settings
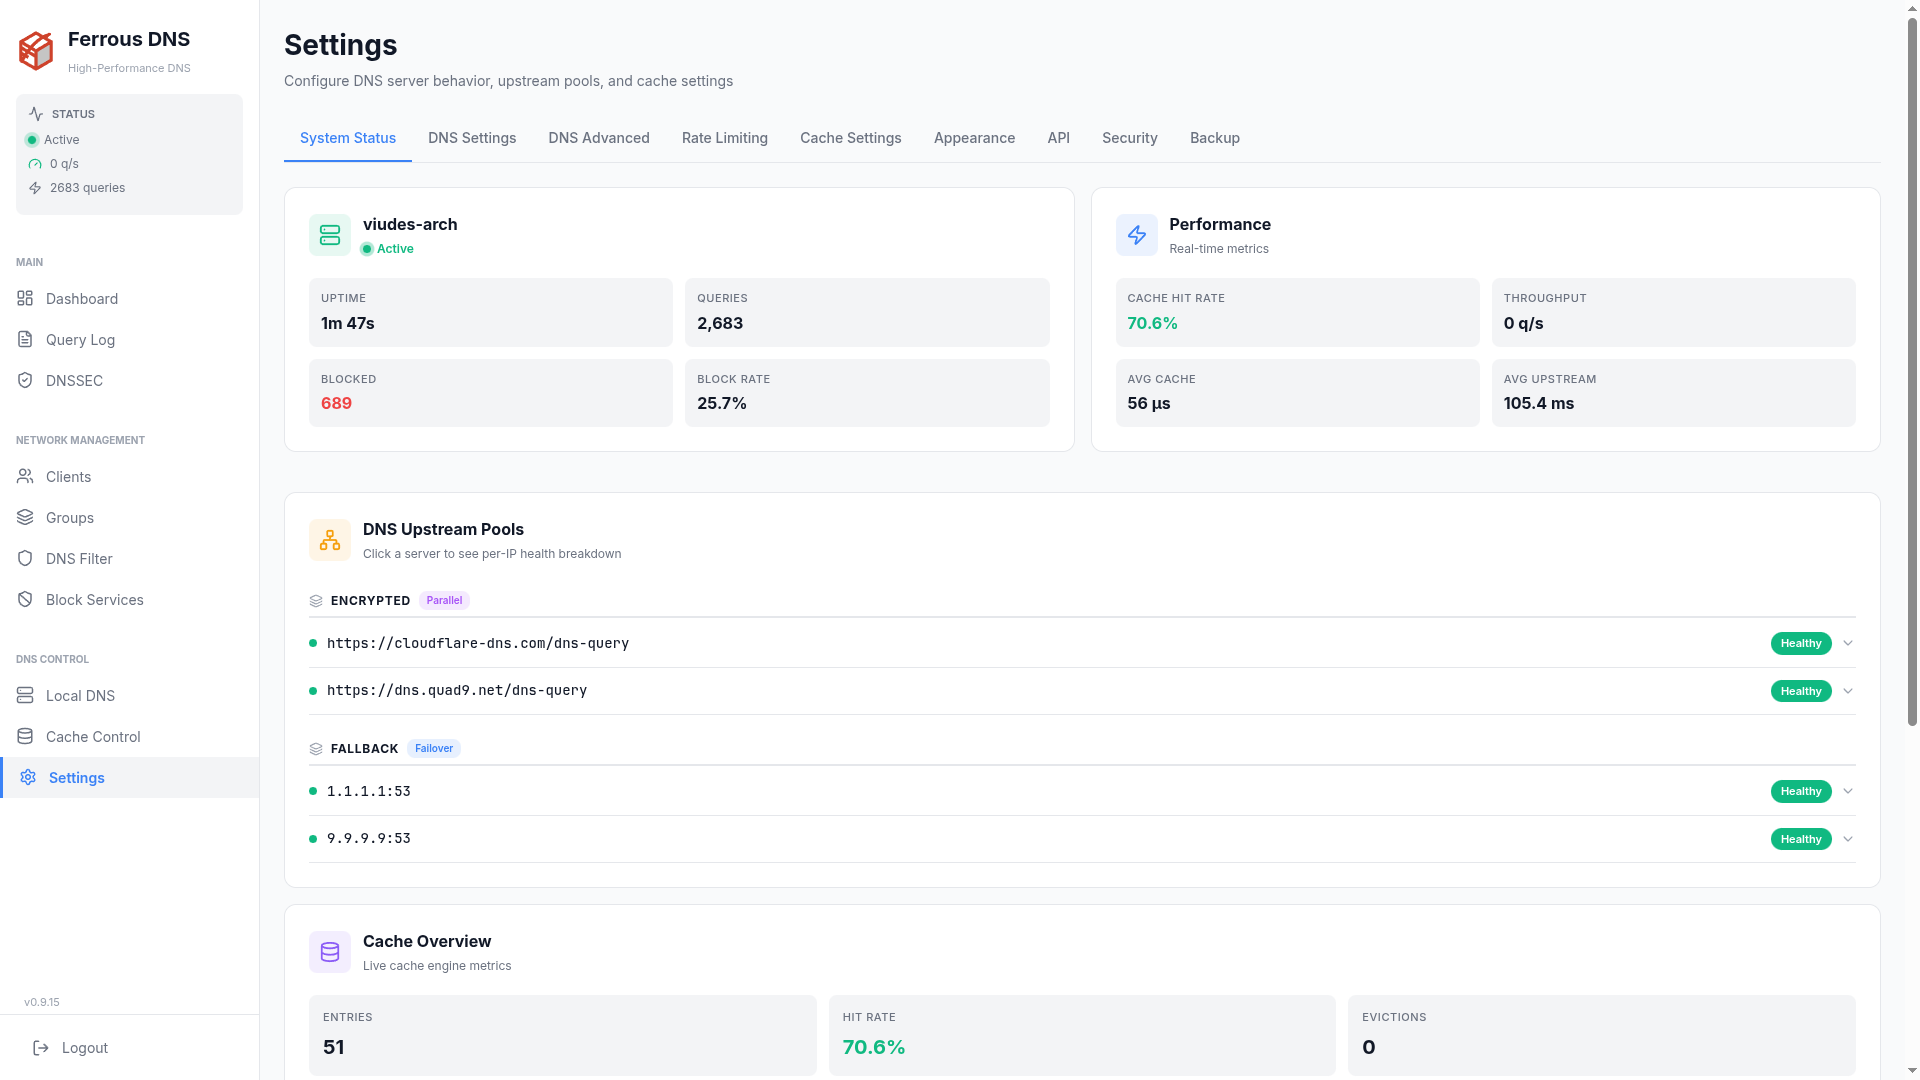
- System Status — hostname, kernel, CPU load, memory usage, uptime
- Upstream Health — per-pool and per-server health status with latency metrics
- Cache Overview — entries, hit rate, evictions, compactions, optimistic refreshes
- DNS Configuration — upstream pools, strategies, DNSSEC, cache settings
- Rate Limiting — enable/disable rate limiting, configure QPS, burst, whitelist, slip ratio, dry-run mode, TCP/DoT connection limits
- DNS Settings — non-FQDN blocking, private PTR blocking, local domain
- API Key — generate, save, or remove the API key
- Dashboard Session Key — authenticate the dashboard for API key-protected servers
- Pi-hole Compatibility — toggle Pi-hole v6 API mode
Dark Mode
The dashboard supports light and dark themes. Toggle via the theme button in the top navigation bar. The preference is saved in localStorage.
Real-Time Updates
The dashboard polls the server at regular intervals:
| Data | Interval |
|---|---|
| Query rate | 1 second |
| Health status, stats, system info | 10 seconds |
Polling pauses automatically when the browser tab is not visible (via the Page Visibility API) to reduce unnecessary network and server load.
API Key Authentication
When an API key is configured on the server, the dashboard needs the key to perform write operations (saving settings, managing blocklists, etc.).
- Go to Settings > Dashboard Session Key
- Enter your API key
- Click Save
The key is stored in localStorage and sent automatically with all API requests via the X-Api-Key header.
Tip
When you generate and save a new API key via the Settings page, the dashboard automatically stores it as the session key.
Pi-hole Compatibility Mode
When pihole_compat = true, the dashboard continues to work normally. The frontend auto-detects the correct API prefix (/ferrous/api instead of /api) via the /ferrous-config.js endpoint.
Third-party Pi-hole dashboards can connect to /api/* using the Pi-hole v6 session-based authentication.